
HELP!
WOULD LIKE YOUR THOUGHTS
ON FIELD DAY!

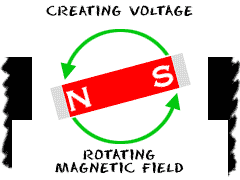 Faraday's law of induction is one of the important concepts of
electricity. It looks at the way changing magnetic fields can cause
current to flow in wires. Basically, it is a formula/concept that
describes how potential difference (voltage difference)
is created and how much is created. It's a huge concept to understand
that the changing of a magnetic field can create voltage.
Faraday's law of induction is one of the important concepts of
electricity. It looks at the way changing magnetic fields can cause
current to flow in wires. Basically, it is a formula/concept that
describes how potential difference (voltage difference)
is created and how much is created. It's a huge concept to understand
that the changing of a magnetic field can create voltage.
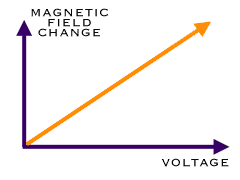 "E" is the value of voltage induced (the old name for
voltage was "ElectroMotive Force", or EMF. That's the "E" in the
equation). The change in time for the experiment is "dt". Time is
measured in seconds. Last is "dB" which stands for the change in
magnetic flux. The magnetic flux is the field lines of the magnetic
field. The flux is equal to BA, where B is the magnetic field strength,
and A is the area. This formula is a bit harder than those you may have
seen before.
"E" is the value of voltage induced (the old name for
voltage was "ElectroMotive Force", or EMF. That's the "E" in the
equation). The change in time for the experiment is "dt". Time is
measured in seconds. Last is "dB" which stands for the change in
magnetic flux. The magnetic flux is the field lines of the magnetic
field. The flux is equal to BA, where B is the magnetic field strength,
and A is the area. This formula is a bit harder than those you may have
seen before.


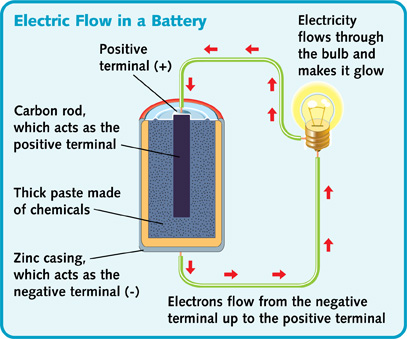
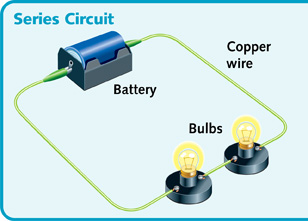
 simple closed circuit


Term
|
Definition
|
Conclusion
|
The solution or answer to a problem. The conclusion is what the scientist has learned about the problem through experimentation.
|
Controlled variable
|
A variable that must remain the same in all situations. Controlled variables are all of the things in an experiment that must remain the same.
|
Data
|
Pieces of information that a scientist will gather and look at. Data consists of information collected through research, experiments, and observations. Conclusions can be made based on data.
|
Data table
|
A T-shaped diagram that displays raw data from an experiment. It includes a manipulated and responding variable.
|
Experiment
|
A test or trial used to gain knowledge or to test a theory.
|
Graph
|
A diagram consisting of lines, bars, or circles to represent information. Science fair experiments usually require line graphs.
|
Hypothesis
|
A reasonable or educated guess. It is what a scientist thinks will happen in an experiment. Hypotheses are based on observations, research, and what is already known about the subject.
|
Log book
|
A notebook in which a scientist writes all of his or her notes about the experiment. All students who complete a science fair project must have a log book.
|
Manipulated variable
|
A variable that is deliberately or intentionally changed by the scientist in an experiment.
|
Metric measurement
|
A system of measurement that scientists use. Length is measured in meters, weight is measured in grams, volume is measured in liters, and temperature is measured in degrees Celsius.
|
Observation
|
The use of the five senses (seeing, hearing, smelling, tasting, or touching) to collect information.
|
Operational definition
|
The way a scientist measures variables. The operational definition explains specifically how each variable will be measured (hours, degrees, meters, liters, grams, decibels, etc.)
|
Ordered pairs
|
Number data that shows a relationship between the manipulated and responding variables. For example, if you gave a plant 10 ml of water each day, and the plant grew a total of 15 cm, then the ordered pair would be (10, 15).
|
Problem
|
Something that needs to be solved. Problems are usually questions that scientists ask about science topics.
|
Procedures
|
A methodical, logical way of doing something. Procedures include directions or plans, listed step by step.
|
Qualitative data
|
Sensory (sight, touch, smell, hearing, taste) information that is used to draw conclusions.
|
Quantitative data
|
Numerical (number) information that is used to draw conclusions.
|
Raw data
|
The initial quantitative information that a scientist gets while conducting an experiment. All raw data is written in a data table in the scientist's log book.
|
Responding variable
|
A variable that changes as a result of the manipulation of another variable. The responding variable is not changed intentionally, rather, it changes because of what the scientist changed intentionally.
|
Scientific Method
|
A logical way of solving problems. Scientists use this method to gather and test information. There are seven steps to the scientific method:
|
Variable
|
Something that can change or "vary" in a situation.
|
X axis
|
The horizontal line at the bottom of a graph. The manipulated variable is always written on the x axis of a graph.
|
Y axis
|
The vertical line on the left side of a graph. The responding variable is always written on the y axis of a graph.
|